Posts

Showing posts from November, 2019

The Future of Work - Connor Morley

Image
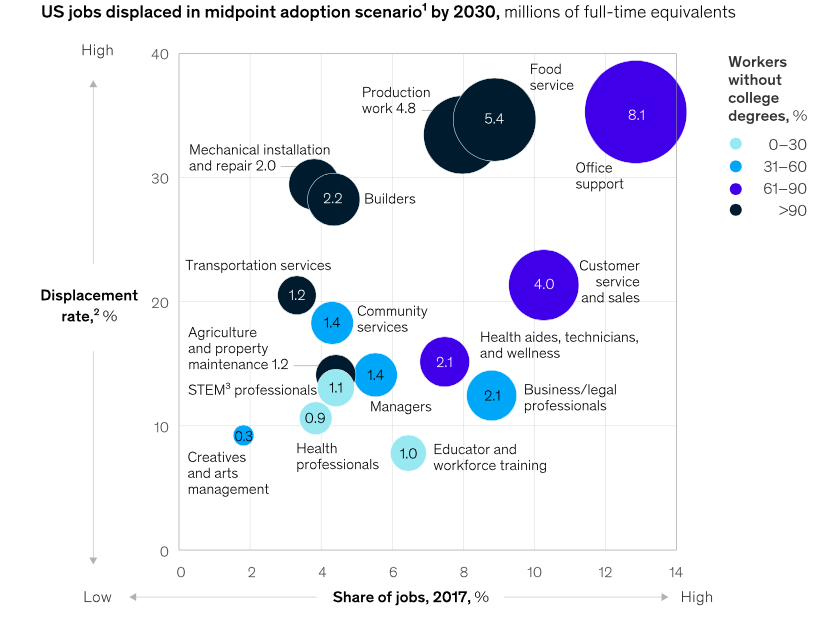
The future of work in America is, like any prediction, ultimately uncertain, but there are numerous factors that are contributing to what can be predicted. Through the careful gathering of data by the McKinsey global institute, it is plain to see what jobs/lines of work are likely set to thrive and which ones might be in danger. It seems to be the trend that the jobs most in danger of displacement are the ones that are on the lower end of the pay scale. This appears to be correlated highly with jobs whose workers do not possess college degrees, as evidenced by this graph: Which shows that college degrees are more important than ever in a global economy less willing to shell out the big bucks on manufacturing and blue-collar work than ever, even though they constitute the largest portion of jobs in the world relative to other occupations, which really illustrates certain inequalities brought-on by a country exemplifying a capitalist model, such as the United States.  My

graphs and my future

The first graph I looked at was what companies would have the highest displacement rates due to the evolution of technology over time. I was intrigued to see food service as the second highest displacement rate. As someone who works in the food industry this really made me think of how technology could evolve more, since my restaurant is already very technologically advanced. I think universally through restaurants, they do need wait staff to bring the food out to the table, but I'm curious to see how the upcoming development could change that. The second graph was about the unevenness of displacement caused by technology advancement. This was interesting to me because it will probably affect where people start to move. It was interesting to me how the most condensed area of displacement is right by Vegas. This caused me to think about how the effect of gambling and all the fun that happens in las vegas, and how technology will affect that. Id think that people could just use gambl

Technological Development in the US - Graphs and Examples - JM

Image
John Mazziotti November 25th, 2019 GPHC Mr. Roddy Tech Development in the US Currently, in the United States, automation is on the rise more than ever and is not only gradually increasing in Mega-Cities, but in smaller towns that are labeled as “High-growth Hubs” have a high rate of technological development. My first graph is on “Annual employment in select segments”, which discusses the percentage of employment from 2007 to 2017, and shows employment data from a plethora of different data points . The next graph I chose is a bar graph and contains a more specific example of job inequality throughout a multitude of different cities, urban areas, etc. This graph shows 2 shades of different shades of blue which remark on the decade difference in job growth. It shows that smaller High-Growth hubs have higher employment growth than all other options on that graph, including mega-cities. The third graph I chose is a net job displacement map that shows what job displacem

Future Work Force

Justin Patera Mr. Roddy GPHC 11/24/19 Future Work For my blog I chose to look at ‘exhibits’ 1,2 and 4. As far as I can tell all three graphs essentially tell the same story from different perspectives. The first looks at how different areas (cities and such) recovered after the Great Recession. The 3rd graph looks at how jobs will correlate with education (or lack thereof) by the year 2030. The 4th looks at which types of cities are most likely to succeed in regards to future employment growth. They all essentially talk about how the poor are going to be screwed over because of the jobs that they tend to be able to obtain. Regardless of this I feel that a lot more than just them will be considered to be replaceable within a short period of time. As we continue to grow and evolve as a global society, it is inevitable that we will not advance as we grow. Having said this our technologies have increased vastly in the past 2 decades alone which has already left more without job

Technology and the Work Force in the Future

Image
This graph shows the potential job growth from 2017-2030 in various occupational fields, and you can see that the jobs that are decreasing, are the ones that are slowly being taken over by technology. Production work for example, that can very easily be done with machinery now, which leaves less room for people who need jobs. Creatives and arts management on the other hand, there is not very much technology that can demonstrate creativity and create art for us, so those jobs have the potential to steadily increase. This graph shows a similar issue, showing which occupational fields will be losing jobs by 2030. It is a similar theory, showing that the job opportunities decreasing the most have to do with professions that can be overtaken by technology. It is also important to take note that the jobs most easily taken over by technology are also the jobs that have the most workers with the least education. Production workers for example, consist of over 90% of employees wit

The Future of Work in America

Image
Charlie McGill Mr. Roddy Global Politics 11/23/2019 The Future of Work As automation continues to take over industries throughout the world, many economists, politicians, and laypersons alike are questioning what the future of work will look like. The health of local, state, and federal economies will all depend on their ability to adapt to the coming age. Much research has already been done on what automation will do to the national economy; after all, that’s where the majority of economic focus lies. However, it is likely that automation will affect local economies even more, in the same way that the departure of industrial work affected the rust belt. The rust belt’s local economies have been shattered, and it is likely that other regions will face the same job losses as their work gets phased out by innovation or moved to other areas of America. However, research like that done by McKinsey gives these regions time to prepare for hardships, find new work, or relocate to booming

Technology and Job Displacement

Although the skills and instincts of people may not be fully replaceable by technology in this era, many of the activities within people’s occupations can be handled more accurately and efficiently by machines. Further, the continuous development of technology will likely benefit people in the long term, because similar to the industrial revolution, which allowed less people to work on cultivating the land and more people to move to urban centers, the incorporation of technology in contemporary jobs will reduce the amount of routine jobs people need to do, and increase the amount of jobs which involve creativity and specific expertise. In the graph displaying the occupational sectors which will likely experience the highest displacement rates, this pattern is clear because lines of work such as office support , production work , and food service are the lines of work which can be most easily replaced by technology. This change could hurt people at first due to the amou

The Future of Work - Sarah Seeliger

The Future of Work The three graphs from the article that I chose to look at were the employment rate graph, the future employment graph, and the top ten jobs affected by displacement graph. The first graph I looked at shows the amount of job employment in high growth hubs will be the most, and that from 2007 to 2017, megacities gained the most amount of jobs. I find this interesting because, on the graph itself, it shows megacities coming in second as far as annual employment. This could be because the annual employment rate was taken out of a percentage of the 2007 employment rate, which would most likely mean that megacities somehow had fewer jobs to start with. Distressed Americana is doing poorly as far as the number of jobs gained as a share of the 2007 workforce, the number of jobs gained from 2007 to 2017, and the annual employment rate. According to the data, Distressed Americana gained -5% of the jobs gained as a share of the 2007 workforce, which is pretty bad. As f

Tech vs The Marginalized - Jadyn Cleary

Image
     The first two graphs I will be analyzing are maps of the US. The first image shows how many jobs will be displaced by technology in counties in the US. The second shows the number of jobs that will be created per county. When comparing these two maps, you can see that the counties that will have the most displaced jobs are not the ones that will be creating new ones. This means that while certain counties suffer from technology in the job market, other counties will benefit from it with minimal overlap. This shift in the job market will most likely lead to many workers moving away from areas where their jobs have been displaced and into areas where new jobs continue to be created. However, those who are unable or unwilling to move will be left behind in the coming years.  The next graph I will delve into is a chart showing which demographics and occupation types are most affected by displacement. This chart shows that job types that are most under threat are those

Tech development

Emily Routbort  Mr. Roddy  GPHC 24 November 2019  Tech development Because the graphs in "The Future of Work" where a bit hard to understand I looked up an article about my area of interest and how technology will affect it. My interest is interior design and to my surprise the growth rate is steady. When I first became interested in interior design I thought that the jobs would become lesser. This is because people are now able to design their own rooms on the internet and get their own furniture on line, thus decreasing the amount of interior design jobs. However, "e mployment of interior designers is projected to grow 4 percent from 2018 to 2028, about as fast as the average for all occupations" [1]. The reason for the employment growth in this job is because people want to be able to have human to human interactions to create what they want. The internet will not be able to tell a person what looks good and what doesn't which is why there is a ma

Eleanor Carter: Tech Development Blog

In graph one titled "Annual Employment in Select Segments" we are shown data about employment in different types of cities. It is obvious that High Growth Hubs beat the competition, and have high employment rates. The situation is very different for distressed Americana cities, and they are shown to have never recovered from the 2007 finical crisis. These graphs show that living in an Urban or Near- Urban area will greet you with higher levels of employment. This is especially the case in many Megacities.  In the third graph titled "US Domestic Population Movement by Area Demographic" we are shown lines merging together representing movement of US citizens from the different types of cities. We have reached a historically low time for migration between states. People aren't moving around the country as much as they used to and this can be attributed to a growing divide between rural and urban areas.  The last graph I studied was entitled "US jobs displa

tech development blog

The first graph that caught my interest was the third graph, it was what jobs will be displaced because there won't be people to fill them. They affect the US all over. Some of these jobs include office workers, food service, production work, managers, community services, public transporters, and builders!!! A lot of these jobs are routine or physical tasks so people might not want to do them. How am I going to eat Shake Shack and drink Starbucks if there is no one to serve me??  I clicked on the fourth graph and it talks about job growth across the nation, as well as loss of jobs due to automation. The place I want to live, my favorite place, San Jacinto County otherwise known as Telluride, Colorado and it was right in the middle. I found that I could get a psychology degree and probably end up working at Starbucks because no one else will and i will not be able to find a job in psychology.  The interactive united states map shows displacement rates. I noticed that San Ja

Tech Development Blog

For my graphs, I chose the first two and the fourth one (Those being % of 2007 job employment today, domestic migration rates to different cities, and net job growth respectively). The main thing that I'm seeing from all of the graphs is that the distressed Americana is really getting left behind in everything. Employment is low, people are moving out of them to find work in bigger cities, and jobs are also leaving them as well. This shows us that jobs are moving out of smaller towns for the most part, and are becoming more concentrated in major cities. I think that as work dries up in the rural parts of America, and as populations in these rural pockets age, many smaller communities will become abandoned simply because there isn't any work in them. However, I think farming communities may do well for themselves due in part because of automation. Farms will be able to run with less people due to automation, and older people will be able to work on them due to being able to use

Technology and Future Work

Image
This graph shows the likely proportions and types of jobs to be displaced by 2030 as well as the education levels of people working these jobs. The article discusses how the most likely jobs to be largely automated first will be repetitive or routine jobs such as food production. While the automation will open up countless new jobs, these will likely require more education and higher skill levels. Since lower skilled jobs are easier to automate, a good education will become even more important for people trying to enter the workforce after 2030 if this scenario proves accurate.  One industry that would be difficult to automate, but will continue to need more workers is the health industry. From my experience shadowing at TCH, I have noticed that one of the major problems at such a big hospital is communication and speed within the hospital. Everything is very slow; some operations last forever because they spend hours waiting for blood or a piece of equipment. With a more compet